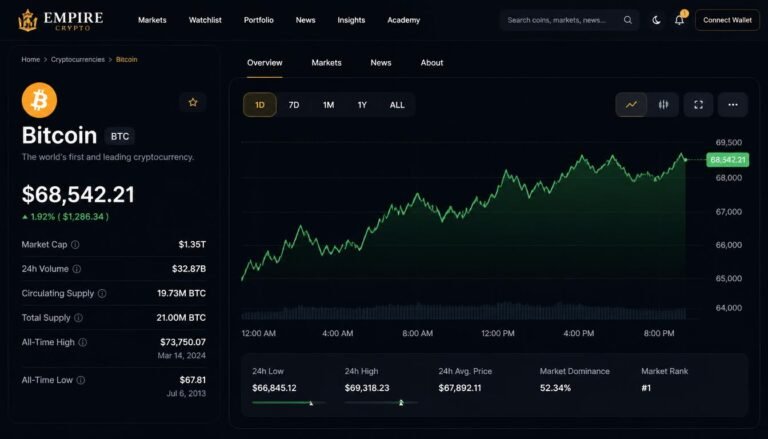
The single biggest mistake new learners make when entering the cryptocurrency space is focusing entirely on token prices. Price is a lagging indicator—it tells you what happened in the past. To understand what is happening right now and what might happen next, you need to look at Crypto Data Online.
Because blockchain networks are public, decentralized ledgers, every transaction, wallet balance, and smart contract interaction is recorded out in the open. The data isn’t hidden inside a corporate bank server; it is freely accessible online.
This comprehensive guide breaks down how to find, interpret, and use online crypto data, taking you from a complete novice to a confident, data-driven researcher.

1. The Three Layers of Crypto Data
To navigate the massive amount of information available online, you must first understand that crypto data is generally split into three distinct buckets.
┌────────────────────────────────────────────────────────────────────────┐
│                              MARKET DATA                               │
│              (Prices, Trading Volumes, Order Books, Exchange Flows)    │
└──────────────────────────────────┬─────────────────────────────────────┘
                                   ▼
┌────────────────────────────────────────────────────────────────────────┐
│                              ON-CHAIN DATA                             │
│              (Active Wallets, Transaction Counts, Hash Rate, Gas Fees) │
└──────────────────────────────────┬─────────────────────────────────────┘
                                   ▼
┌────────────────────────────────────────────────────────────────────────┐
│                             PROJECT METRICS                            │
│              (Total Value Locked, Protocol Revenue, Developer Activity)│
└────────────────────────────────────────────────────────────────────────┘
Market Data
This is the most common data type found on consumer financial websites. It originates from cryptocurrency exchanges (like Binance, Coinbase, or OKX) and tracks pure trading metrics.
- Key metrics: Circulating supply, 24-hour trading volume, order book depth, and historical price charts.
On-Chain Data
This is raw data pulled directly from the blockchain ledger itself. It reflects actual network utility rather than speculative trading.
- Key metrics: Number of active daily wallet addresses, total transaction counts, network transaction fees (gas), and whale wallet movements (large holders moving funds).
Project Metrics (DeFi & Web3 Data)
This layer tracks the operational health of decentralized applications (dApps), such as lending protocols, decentralized exchanges (DEXs), and NFT platforms.
- Key metrics: Total Value Locked (TVL), protocol revenue, unique active users, and developer code updates on GitHub.
2. Core Platforms for New Learners
You do not need to write complex code or manage expensive databases to access this information. A handful of highly intuitive, free online platforms compile this data into clean visual dashboards.
Market Data aggregators
- CoinGecko & CoinMarketCap: The fundamental starting points. Use these to check a token’s verified circulating supply, contract addresses (to avoid fake token scams), and historical market caps.
On-Chain Visualizers
- DeFiLlama: The premier platform for tracking decentralized finance ecosystems. It tracks TVL, yields, and protocol revenues across hundreds of distinct blockchain layers.
- Token Terminal: Think of this as the Bloomberg Terminal for crypto. It formats blockchain data like traditional corporate financial statements, displaying price-to-fees ratios, operational costs, and total revenue.
- Arkham Intelligence: A visual forensic platform that links anonymous blockchain addresses to real-world entities (exchanges, funds, and developers), allowing you to trace exactly where large quantities of crypto are moving.
3. Five Essential Metrics Every Beginner Must Know
When you look at a crypto data dashboard for the first time, ignore the hundreds of minor data points and focus strictly on these five foundational health metrics.
1. Market Capitalization vs. Fully Diluted Valuation (FDV)
Market Cap is calculated as $\text{Current Price} \times \text{Circulating Supply}$. However, many crypto projects keep a large percentage of their total tokens locked away to be released over several years.
Fully Diluted Valuation (FDV) calculates what the market cap would be if all tokens were unlocked ($\text{Current Price} \times \text{Maximum Supply}$).
⚠️ Beginner Warning: If a project has a Market Cap of $10 million but an FDV of $500 million, a massive wave of new tokens will enter the market over time, which can aggressively dilute the value of your holdings.
2. Total Value Locked (TVL)
Primarily used in DeFi, TVL represents the total amount of crypto assets currently deposited, staked, or locked inside a protocol’s smart contracts. A rising TVL indicates growing user trust and capital commitment, while a sharp drop in TVL is often a leading indicator that Crypto Data Online is fleeing the ecosystem due to security worries or dropping yields.
3. Daily Active Addresses (Crypto Data Online)
This metric tracks the number of unique blockchain addresses that conducted a transaction on a given day. Think of DAA as the “Daily Active Users” metric of a tech startup. If a cryptocurrency’s price is skyrocketing but its Daily Active Addresses are flat or falling, the price move is likely driven by short-term speculation rather than structural network adoption.
4. Protocol Revenue vs. Token Incentives
A healthy web3 protocol should generate organic fee revenue from its users. If a protocol generates $1 million a week in fees but has to hand out $5 million a week in newly minted tokens as “staking rewards” to attract those users, it is operating at a massive loss. Use platforms like Token Terminal to verify that a project has real, sustainable cash flows.
5. Exchange Net Flows
This metric tracks the net amount of a specific cryptocurrency moving in and out of centralized exchange wallets.
- Positive Flow (Inflow): More crypto is moving onto exchanges than leaving. This usually means investors are preparing to sell, signaling potential downward price pressure. Crypto Data Online
- Negative Flow (Outflow): More crypto is being withdrawn off exchanges into private, long-term storage wallets. This indicates a strong holding sentiment and reduces immediate selling pressure.
4. Step-by-Step Data Analysis Guide
To help you get comfortable navigating these free tools, follow this simple project analysis routine. This process ensures you look past marketing hype and analyze a project based on real numbers.
1.Verify the Smart Contract Address:Platform: CoinGecko.
Search for the project on CoinGecko. Locate the “Contract” field and copy the official alphanumeric string. Never search for contract addresses on social media, as scammers frequently deploy fake clone tokens with the exact same name to steal user funds.
2.Analyze Supply and Dilution:Platform: CoinGecko / CoinMarketCap. Crypto Data Online
Compare the project’s Circulating Supply against its Total or Max Supply. Check the Fully Diluted Valuation (FDV). If the circulating supply is less than 20% of the maximum supply, look for the project’s token vesting schedule online to find out when the next major unlock event occurs.
3.Check Ecosystem Growth and Crypto Data Online:Platform: DeFiLlama.
Type the project name into DeFiLlama. Look at the historical TVL chart. Is the capital locked in the protocol growing steadily over a 3-month or 6-month period, or was there an artificial spike followed by a steep drop-off?
4.Audit Real User Adoption:Platform: Token Terminal or Etherscan.
Look up the token’s daily active user count and daily transaction volume. Verify that the network is hosting genuine activity. High transaction counts combined with low unique user addresses often hint at wash trading (bots trading back and forth to fake activity).
5.Trace Large Holder Movements:Platform: Arkham Intelligence.
Plug the token name or its top known addresses into Arkham. Observe the “Top Holders” list. If a small handful of anonymous private wallets control more than 50% of the total supply, the project has a highly centralized structure, leaving it vulnerable to sudden, massive sell-offs if a single insider decides to exit.
Summary Checklist for New Learners
Keep this quick reference guide handy whenever you evaluate a crypto project online:
| Data Type | Good Sign (Bullish) | Warning Sign (Bearish) |
| Exchange Flows | Large, consistent outflows to cold storage | Sudden, massive inflows into exchange wallets |
| User Activity | Steady, organic growth in Daily Active Addresses | Falling user counts despite an increasing token price |
| Supply Dynamics | High circulating supply relative to the total Max Supply | Low circulating supply with a massive, hidden FDV |
| Protocol Revenue | Users paying fees that exceed token emissions | Protocol relies entirely on inflation to incentivize users |
💡 Data Principle: In the world of open public ledgers, trust what people do, not what they say. Social media posts can be bought, and marketing materials can make grand claims, but the public on-chain data never lies.