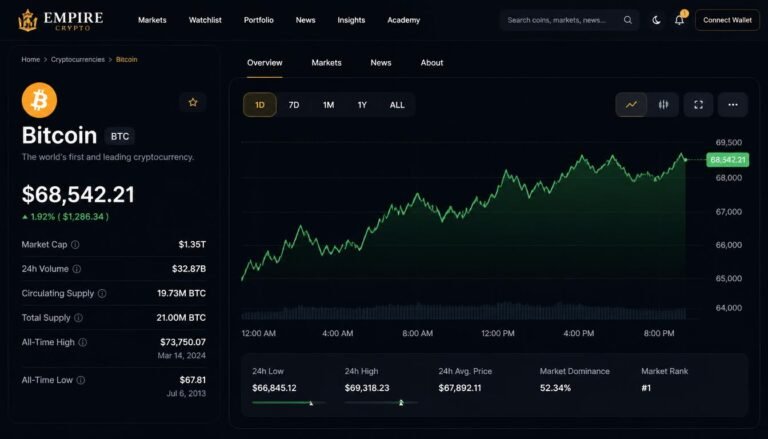
The cryptocurrency market moves at lightning speed, operating 24 hours a day, 7 days a week across global decentralized networks. For beginner and intermediate traders alike, navigating this landscape without concrete metrics is like flying an airplane through a storm with your eyes closed. In this definitive guide to Crypto Data: Smart Cryptocurrency Tips, we unpack how real-time network metrics, liquidity profiles, and volume analysis transform raw information into profitable trading strategies. At Empire Crypto, our mission is to demystify complex blockchain telemetry and convert chaotic price charts into actionable intelligence.

Why Smart Cryptocurrency Data is Your Biggest Advantage
In traditional finance, retail investors often suffer from information asymmetry because institutional funds hold exclusive access to Bloomberg terminals and private order routing feeds. However, public blockchain architecture fundamentally flips this paradigm. Every single transaction, smart contract execution, token unlock, and exchange transfer is permanently recorded on an immutable public ledger.
When you know how to read data crypto feeds, you gain direct access to the same fundamental truth that multi-billion-dollar hedge funds monitor.
The Evolution of Crypto Market Data
In the early days of Bitcoin, market analysis was almost entirely restricted to primitive candlestick price charts and aggregate exchange volumes. Today, modern crypto market data encompasses dozens of multidimensional layers:
- On-Chain Health Metrics: Active wallet addresses, hash rate, transaction velocity, and network fees.
- Exchange Liquidity Depth: Bid-ask spreads, order book thickness, order flow toxicity, and slippage estimates.
- Derivatives Positioning: Open interest, perpetual funding rates, option skew, and liquidation clusters.
- Sentiment & Social Signals: Social sentiment velocity, developer commit volume, and search trend momentum.
- Financial Fundamentals: Protocol revenue, price-to-fees ratios, treasury reserves, and token burn rates.
Without structured data analytics cryptocurrency frameworks, traders quickly succumb to information overload. Empire Crypto simplifies this firehose of information into focused, high-probability trading signals.
Understanding Crypto Data: The Core Pillars for Smart Investors
To build a reliable market strategy, you must categorize your inputs into distinct categories. Relying solely on price movement leaves you vulnerable to fakeouts and stop-hunts. Here is how Empire Crypto breaks down the essential pillars of cryptocurrency market data.
1. On-Chain Data vs. Off-Chain Market Data
Understanding the difference between on-chain and off-chain sources is crucial when evaluating any crypto data solution.
- On-Chain Data: Sourced directly from blockchain nodes. It reflects immutable, settled activity such as native token transfers, smart contract interactions, total value locked (TVL), and wallet balance shifts. On-chain data represents structural reality.
- Off-Chain Data: Generated inside centralized exchange (CEX) matching engines, social platforms, and off-chain messaging networks. This includes centralized order books, spot trading volume, high-frequency order flows, and market sentiment. Off-chain data represents immediate tactical price action.
Empire Crypto Smart Tip: Never evaluate on-chain signals in complete isolation. An bullish on-chain accumulation signal can easily be overridden in the short term if off-chain derivatives markets experience a cascade of forced liquidations.
2. Volume, Liquidity, and Order Book Metrics
High price action on low trading volume is an illusion. When analyzing best crypto data, volume and order book depth reveal whether a price move has genuine institutional backing.
- Real Volume vs. Wash Volume: High-grade cryptocurrency data analytics filters out artificial wash trading on unregulated exchanges to reveal authentic spot buying power.
- 2% Order Book Depth: Measures the total dollar value of buy bids and sell asks within 2% of the mid-market price. High 2% depth guarantees low slippage for sizable trades.
- Slippage Rates: The percentage difference between your expected trade price and the actual executed price. Thin liquidity leads to massive slippage, destroying profit margins.
About Empire Crypto Data Solutions
When searching for a trusted crypto data company, institutional precision and data accessibility are paramount. Empire Crypto was established to bridge the gap between complex raw node telemetry and everyday retail implementation.
As a leading crypto data company, Empire Crypto Data aggregation engines ingest, normalize, and verify millions of real-time market events across top layer-1 blockchains, decentralized finance (DeFi) protocols, and global exchange venues every second.
What Sets Empire Crypto Apart?
- Uncompromising Cryptocurrency Data Reliability: Our data architecture cross-references multi-node consensus feeds to eliminate false reporting, lag spikes, and anomalous exchange pricing.
- Holistic Analytics Engine: From tracking micro-cap token unlocks to mapping Bitcoin macro miner capitulation, Empire Crypto combines multi-chain metrics into one intuitive dashboard.
- Tailored for All Skill Levels: Beginner-friendly visualizations meet enterprise-grade API connectivity, empowering users at every step of their crypto journey.
Through Empire Crypto Data tools, traders gain the confidence needed to make calculated moves in volatile market conditions.
Beginner Guide: Smart Cryptocurrency Tips for Reading Crypto Market Data
If you are new to the digital asset space, staring at complex metrics can feel overwhelming. Empire Crypto recommends starting with a clean, disciplined process. Here are five foundational crypto data analysis steps that every beginner should master before risking capital.
5 Foundational Tips for Crypto Data Beginners
- Check Market Capitalization vs. Fully Diluted Valuation (FDV):
- Market Cap = Current Circulating Supply × Current Token Price.
- FDV = Total Maximum Supply × Current Token Price.
- Empire Crypto Rule: If a token’s FDV is 10 times larger than its current Market Cap, massive future token unlocks will create ongoing selling pressure.
- Monitor Exchange Inflows and Outflows:
- Large transfers from private cold storage wallets into centralized exchanges signal potential intent to sell.
- Large transfers from exchange wallets out into cold storage suggest long-term institutional accumulation.
- Evaluate Total Value Locked (TVL) in DeFi Protocols:
- TVL measures the aggregate capital deposited in a project’s smart contracts.
- Rising TVL alongside a stagnant or falling token price indicates an undervalued protocol with strong organic usage.
- Analyze Active Address Dynamics:
- A healthy cryptocurrency network experiences steady, organic growth in daily active addresses.
- If a coin’s price skyrockets while active wallet addresses decline, the rally is driven by speculation rather than actual network adoption.
- Use Social Volume as a Reverse Sentiment Indicator:
- When social media excitement reaches extreme euphoria, markets are often near local tops.
- When fear dominates and social chatter falls off a cliff, smart money quietly accumulates.
Real-World Beginner Example: Tracking Whale Movements Before a Rally
Let’s look at a concrete case study analyzed by Empire Crypto.
Imagine Token XYZ is trading sideways in a tight range between $1.20 and $1.25 over three weeks. To the average retail trader using basic price charts, nothing exciting is happening.
However, an Empire Crypto user monitoring cryptocurrency market data notices three critical data points:
- Exchange Outflows: Over 15 million units of Token XYZ leave exchange wallets for newly created self-custody wallets over 48 hours.
- Top Holder Concentration: The top 50 non-exchange wallets increase their holdings by 4.2% while retail address counts remain static.
- Order Book Bid Depth: Institutional buy walls at $1.18 thicken considerably, absorbing sell market orders without allowing price breakdowns.
Result: Five days later, Token XYZ breaks out of its consolidation range, surging 45% to $1.80. Traders who relied purely on chart patterns missed the early setup, but Empire Crypto users leveraging smart data crypto signals spotted the institutional accumulation well in advance.
Advanced Techniques: Trading Data Analysis Cryptocurrency Strategies
Once you understand basic wallet tracking and exchange volume, you can advance to professional-grade trading data analysis cryptocurrency frameworks. These methods focus on market mechanics, leverage dynamics, and structural liquidity.
1. Derivatives Metrics: Funding Rates, Open Interest, and Liquidations
Derivatives markets (perpetual futures and options) heavily influence short-to-medium-term price action. Empire Crypto analysts track three core derivatives metrics to gauge market positioning:
| Metric | What It Measures | Bullish Signal | Bearish Signal |
| Open Interest (OI) | Total dollar value of outstanding derivative contracts. | Rising OI with steady spot volume indicates strong trend confirmation. | Spiking OI on extreme leverage warns of an imminent liquidation cascade. |
| Funding Rate | Periodic fee paid between long and short traders to anchor perp prices to spot prices. | Slightly positive or negative funding rates signal healthy, spot-driven trends. | Massively high positive funding shows over-leveraged longs susceptible to a drop. |
| Liquidation Heatmaps | Concentrated price bands where leveraged positions will be forcibly closed. | Liquidation pools above price act as magnetic targets during short squeezes. | Large liquidation pools below price draw market-makers down to sweep liquidity. |
Empire Crypto Advanced Strategy: When Open Interest surges to all-time highs while Funding Rates become excessively positive, avoid entering long positions. Market makers often push prices down to sweep liquidation clusters before resuming macro uptrends.
2. Tokenomics & Token Unlock Schedule Analysis
Tokenomics dictates the long-term structural supply curve of an asset. Empire Crypto categorizes token unlocks into two types:
- Cliff Unlocks: Large cliffs release millions of tokens in a single second, usually allocated to early venture investors, advisors, or core team members.
- Linear Unlocks: Tokens are released incrementally block-by-block over extended periods.
Calculating Unlock Pressure Impact
To assess the potential market impact of an upcoming unlock, Empire Crypto uses the following formula:
$$\text{Unlock Impact Ratio} = \frac{\text{Dollar Value of Upcoming Unlocked Tokens}}{\text{Average Daily Spot Volume (30-Day)}}$$
If the Unlock Impact Ratio exceeds 1.5 (150%), spot markets will struggle to absorb the selling pressure without a severe price pullback. Empire Crypto tools track these unlock schedules in real time, helping you hedge or exit positions before dilution events take place.
3. Cross-Chain Liquidity Flows & Arbitrage Signals
As Web3 expands across dozens of Layer-1 networks and Layer-2 rollups, capital moves dynamically between ecosystems. Tracking cross-chain bridge flows provides early signals for emerging sector rotations.
When multi-chain crypto data analytics detect massive USDC or Ethereum inflows bridging into an emerging Layer-2 ecosystem, token valuations across that target ecosystem typically surge within 7 to 14 days. Empire Crypto tracks cross-chain bridge activity so you can enter ecosystem trades before retail capital catches on.
The Ultimate Checklist: Evaluating Cryptocurrency Data Reliability
Not all crypto data solutions offer equal speed or precision. Relying on delayed or manipulated metrics can lead to costly mistakes. Before trusting any cryptocurrency data source, run it through this rigorous Empire Crypto Quality Checklist.
- Direct Node Sourcing: Does the platform query raw blockchain nodes directly, or does it re-package delayed third-party API data?
- Latency and Refresh Rate: Are on-chain transfers and exchange order books updated in real time (sub-second to block speed)?
- Anomaly Detection Filtering: Does the data engine scrub out outlier trades, flash-loan artifacts, and exchange wash trading?
- Multi-Chain Coverage: Does the platform index major Layer-1s, Layer-2s, and cross-chain bridges?
- Historical Data Depth: Does the platform maintain clean historical records across multiple market cycles for effective backtesting?
- Transparent Methodology: Are proprietary metrics clearly defined and mathematically verifiable?
Maintaining absolute cryptocurrency data reliability is essential for executing confident, systematic trading strategies.
Real-World Use Cases: How Empire Crypto Traders Win with Smart Data
To demonstrate the power of data-driven decisions, let’s explore three practical scenarios where Empire Crypto insights helped traders outperform the market.
Case 1: Spotting a Fakeout Breakout in Bitcoin
- Scenario: Bitcoin surges past a key resistance level at $95,000, creating massive excitement across social media.
- Retail Action: Fearing they will miss out, retail traders rush to buy at the breakout price.
- Empire Crypto Data Insight:
- Spot exchange cumulative volume delta (CVD) remains flat, indicating no real spot buying.
- Open Interest on futures markets surges by $1.2 billion in two hours, driven entirely by aggressive market orders.
- Funding rates spike into extreme positive territory.
- Outcome: Empire Crypto identifies the move as a leverage-driven fakeout. Within six hours, prices drop sharply back to $91,000, liquidating late long positions. Traders who checked the data avoided buying the top and safely picked up discounted spot positions at support.
Case 2: Identifying DeFi Yield Sustainability
- Scenario: A new decentralized lending protocol offers an enticing 85% APY on stablecoin deposits.
- Retail Action: Yield farmers rush capital into the pool, chasing high short-term returns.
- Empire Crypto Data Insight:
- Empire Crypto Data tools show that 90% of the yield is paid out in the protocol’s hyper-inflationary native governance token, rather than organic borrow fees.
- Token unlock schedules reveal that early liquidity providers are unlocking and dumping 5% of the total token supply every week.
- Outcome: Within three weeks, the governance token drops 70% in value, wiping out yield gains for late entrants. Empire Crypto users avoided the trap by choosing protocols with sustainable, fee-backed revenue models.
Case 3: Riding Smart Money Accumulation in Altcoins
- Scenario: A mid-cap Layer-2 infrastructure token trades quietly with minimal price movement.
- Empire Crypto Data Insight:
- Wallet labeling algorithms at Empire Crypto detect multiple venture capital and institutional wallets systematically accumulating the token via decentralized exchange aggregators over a three-week window.
- On-chain supply held on centralized exchanges drops from 28% to 14%.
- Outcome: Empire Crypto traders follow smart money accumulation, entering positions at an average price of $0.45. A month later, mainnet integration announcements spark a public rally to $1.35—yielding a 3x return.
Essential Metrics Summary: The Empire Crypto Quick Reference Guide
Bookmark this table to quickly reference essential metrics during your market research routines.
Frequently Asked Questions (FAQ)
Here are clear, data-driven answers to common questions about cryptocurrency data analysis.
What is crypto data and why is it essential for trading?
Crypto data refers to the quantitative records generated across blockchain networks and digital asset exchanges. It includes on-chain metrics (wallet activity, smart contract usage), off-chain metrics (order books, trading volume), and derivatives figures (funding rates, open interest). Analyzing this data allows traders to make objective, evidence-based decisions rather than relying on emotion or rumors.
How does Empire Crypto help investors analyze cryptocurrency data?
Empire Crypto aggregates, filters, and presents raw blockchain data through intuitive dashboards and actionable signals. By removing node latency and scrubbing out manipulated trading volumes, Empire Crypto provides clean metrics that allow traders to track whale behavior, monitor leverage risks, and spot undervaluation opportunities.
What is the most important on-chain metric for beginners?
For beginners, Exchange Netflows and Active Address Growth offer the clearest signals. Steady growth in active wallet addresses indicates expanding network adoption, while net outflows from exchanges suggest that long-term investors are accumulating and moving assets into secure storage.
Can crypto market data predict price movements with 100% certainty?
No analytical tool or metric can predict future price action with absolute certainty. Cryptocurrency markets are dynamic systems influenced by macroeconomic shifts, regulatory announcements, and unexpected liquidity events. However, utilizing high-quality cryptocurrency market data significantly increases your probabilities and helps manage downside risk effectively.
What is the difference between spot volume and derivatives volume?
Spot volume represents the actual buying and selling of underlying cryptocurrency tokens for immediate delivery. Derivatives volume involves futures or options contracts that speculate on asset prices using leverage. Sustainable price trends are backed by spot volume growth, whereas leverage-heavy derivatives volume often leads to sharp reversals and forced liquidations.
How can I verify cryptocurrency data reliability before making a trade?
Ensure your data provider queries raw blockchain nodes directly, updates feeds in real time, and uses machine learning filters to eliminate wash trading. Empire Crypto upholds strict cryptocurrency data reliability standards, providing clear, verified insights you can trust during fast-moving markets.
Conclusion: Take Control of Your Crypto Future with Empire Crypto
The digital asset ecosystem rewards preparation and penalizes guesswork. Price charts only show you where the market has been—crypto data reveals where capital is moving right now. By mastering on-chain metrics, tracking exchange liquidity, evaluating tokenomics, and monitoring leverage dynamics, you gain a massive edge over participants relying solely on speculation.
At Empire Crypto, we believe everyone deserves access to clear, reliable, institutional-grade market intelligence. Whether you are executing spot allocations or navigating complex derivatives, let data be your compass.