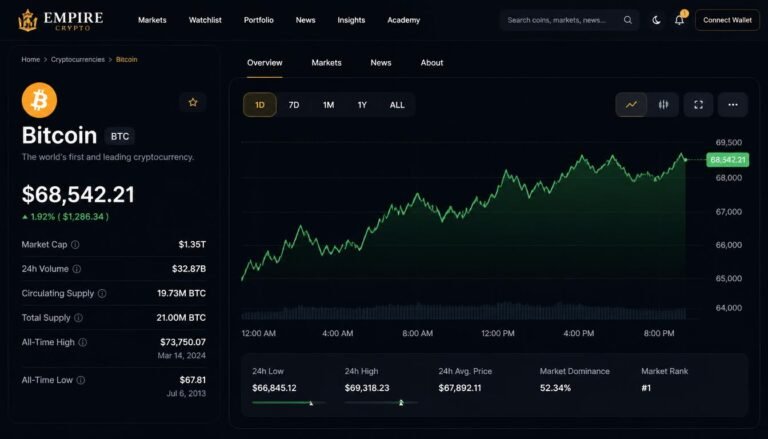
Decentralized Finance (DeFi) has transformed global finance by removing traditional gatekeepers and replacing them with smart contracts. However, trading and investing in DeFi without clean, accurate crypto data is like sailing into a storm without a compass. Welcome to Crypto Data, your premier guide to mastering the complex world of decentralized finance. Whether you are a newcomer taking your first steps in Web3 or an intermediate trader refining your yield strategies, making informed financial decisions requires high-precision insights.

Why Crypto Data is Essential in Decentralized Finance
Unlike traditional financial markets where order books and bank balances are tucked away behind institutional firewall systems, blockchain networks are open ledgers. Every transaction, swap, deposit, liquidation, and reward emission is broadcast publicly in real time.
However, raw blockchain transactions are noisy. Millions of raw hashes stream across networks like Ethereum, Solana, Arbitrum, Base, and Polygon every single minute. To convert this noise into actionable intelligence, traders rely on specialized tools and crypto data solutions designed to index, clean, and organize on-chain records.
Raw Blockchain Data  -->  Data Indexing & Cleaning  -->  Actionable Crypto Data Insights
(Hashes & Blocks)        (The Graph, Oracles)            (TVL, Volume, APY, Impermanent Loss)
Leveraging accurate cryptocurrency data analytics gives you a distinct edge:
- Eliminate Blind Spots: See real-time capital flows across protocols before price charts reflect them.
- Verify Protocol Health: Track liquidity depth, collateral ratios, and wallet concentration to avoid bad debt risks.
- Optimize Yield Farming: Identify sustainable Annual Percentage Yields (APY) backed by trading fees rather than inflationary token emissions.
- Detect Smart Money Movements: Monitor institutional wallet activity and whale deposits across liquid staking and lending pools.
When you ground your trading decisions in verified crypto data analysis, you reduce emotional biases and navigate the market with calculated precision.
Key Metrics in Crypto Data Analytics
To make sense of decentralized finance, you must understand the foundational metrics that drive protocol evaluations. Below is an overview of the core analytical metrics every crypto participant must master.
| Metric Name | Full Form / Concept | Primary Function | Ideal Trend |
| TVL | Total Value Locked | Measures the total dollar value of assets deposited in a protocol’s smart contracts. | Steady or rising growth relative to market cap. |
| DEX Volume | Decentralized Exchange Volume | Tracks the dollar amount traded across automated market maker (AMM) pools. | High volume-to-TVL ratio indicates capital efficiency. |
| MCAP / TVL | Market Cap to TVL Ratio | Evaluates whether a protocol’s native governance token is overvalued or undervalued. | Ratio under 1.0 often indicates potential undervaluation. |
| Protocol Revenue | On-Chain Revenue | Measures actual fees collected by the protocol and distributed to token stakers or treasuries. | Consistently expanding organic fee revenues. |
| Net Flow | Inflow vs. Outflow | Monitors real-time balance changes of stablecoins and major crypto assets within liquidity pools. | Positive net inflows indicate growing user confidence. |
Core Pillars of DeFi Data Infrastructure
Understanding decentralized finance requires looking under the hood of modern blockchain technology. The DeFi ecosystem relies on five core pillars, each producing unique streams of cryptocurrency data.
+-----------------------------------------------------------------------+
|                       DeFi Infrastructure Pillars                     |
+-------------------+------------------+-------------------+------------+
|  Liquid Staking   | Lending/Borrowing|       DEXes       | Restaking  |
|  (Lido, Rocket P) | (Aave, Morpho)   | (Uniswap, Curve)  | (EigenL)   |
+-------------------+------------------+-------------------+------------+
                                     ^
                                     | Powered By
                        +---------------------------+
                        |  Oracles (Pyth, Chainlink)|
                        +---------------------------+
1. Liquid Staking Tokens (LSTs)
Liquid staking derivatives have grown into one of the largest market sectors by TVL. Protocols like Lido and Rocket Pool allow users to stake assets like ETH or SOL to secure proof-of-stake networks while issuing liquid receipt tokens (e.g., stETH).
- Data Focus: Track peg stability (stETH:ETH ratio), staking yield variations, and validator concentration.
2. Decentralized Lending and Borrowing
Lending platforms such as Aave and Morpho operate as automated money markets. Users deposit assets to earn interest or supply collateral to borrow stablecoins like USDC or USDT.
- Data Focus: Monitor collateral health factors, utilization rates, liquidation thresholds, and borrowing interest rate curves.
3. Automated Market Makers (AMMs) & DEXes
Decentralized exchanges like Uniswap and Curve enable peer-to-peer asset swapping without custodial intermediaries.
- Data Focus: Analyze liquidity depth within dynamic price bands (concentrated liquidity), slippage curves, swap volume, and fee generation per pool.
4. Restaking Protocols
Restaking allows users to take their staked ETH or LSTs and re-pledge them to secure additional decentralized services and middleware.
- Data Focus: Measure slashing risk conditions, operator uptime, and extra yield yield-stacking compositions.
5. On-Chain Oracles
Oracles like Pyth Network deliver sub-second, real-time market price data directly to smart contracts. Without decentralized price feeds, lending liquidations and perpetual trades could not execute accurately.
- Data Focus: Monitor price feed latency, update frequencies, and deviation thresholds.
By leveraging robust data analytics cryptocurrency infrastructure, analysts can monitor each of these pillars simultaneously to construct market strategies.
Beginner Guide: How to Read and Evaluate DeFi Market Data
If you are new to Web3 analytics, interpreting data crypto feeds can seem complex. Following a structured evaluation process helps simplify on-chain metrics into clear insights.
Step 1: Protocol Discovery --> Step 2: TVL & Volume Check --> Step 3: Yield Breakdown --> Step 4: Security Audit
Step 1: Protocol Discovery and TVL Verification
Start by identifying protocols with growing adoption. Look for platforms showing steady growth in Total Value Locked over 30, 90, and 180 days. A sudden spike in TVL can signal temporary mercenary capital chasing short-term rewards, whereas steady organic growth indicates long-term trust.
Step 2: Evaluating Volume and Capital Efficiency
Compare a protocol’s daily trading volume against its Total Value Locked.
$$\text{Capital Efficiency Ratio} = \frac{\text{Daily Trading Volume}}{\text{Total Value Locked}}$$
- A high ratio means capital is actively turning over, producing trading fees for liquidity providers.
- A low ratio suggests dormant liquidity that generates minimal organic yield.
Step 3: Deconstructing Yield (Real Yield vs. Emission Dilution)
Always question where yield originates. High Annual Percentage Yields (APYs) can be deceptive:
- Real Yield: Generated from actual platform usage, such as trading fees, borrowing interest, or liquidations.
- Emissions Yield: Paid out in freshly minted governance tokens. High emissions often dilute token value over time, leading to rapid capital flight once rewards drop.
Step 4: Reviewing Security and Contract Verification
Never deposit assets into an unverified protocol. Reliable cryptocurrency data reliability evaluation requires checking whether smart contracts are audited by reputable security firms, verified on blockchain explorers, and battle-tested over long periods without exploits.
Using accurate crypto market data allows beginners to make safer, data-backed decisions instead of relying on market hype.
Advanced Section: On-Chain Data Analysis & Quantitative Yield Strategies
For intermediate and advanced DeFi users, extracting profit requires moving beyond basic surface metrics and building quantitative on-chain models.
Concentrated Liquidity Optimization
Modern DEX protocols allow liquidity providers (LPs) to allocate capital within customized price ranges. While concentrated liquidity drastically increases fee earnings per dollar spent, it also amplifies impermanent loss if prices move outside the selected range.
Mathematical Representation of Concentrated Liquidity Fee Capture
When assets remain within range $[P_a, P_b]$, the effective liquidity multiplier $L$ operates at significantly higher capital efficiency compared to full-range $V_2$ pools:
$$L = \frac{\Delta Y}{\Delta \sqrt{P}}$$
Advanced traders analyze historical price volatility and volume density charts to set tighter price bounds during consolidation periods and wider bounds during high-volatility cycles.
Tracking Health Factors in Algorithmic Lending
When supplying assets to platforms like Aave, monitoring your position’s Health Factor ($H_f$) is critical to avoid liquidation penalties:
$$H_f = \frac{\sum (C_i \times ETH_i \times L_i)}{\text{Total Borrowed Amount in } ETH}$$
Where:
- $C_i$ represents the amount of collateral asset $i$.
- $ETH_i$ represents the price valuation in base currency.
- $L_i$ represents the liquidation threshold parameter for collateral asset $i$.
A Health Factor below $1.0$ triggers immediate liquidation of collateral. Advanced users employ automated alerts built on crypto data solutions to rebalance collateral ratios before market downturns strike.
+-----------------------------------------------------------------+
|                    Health Factor ($H_f$) Zones                  |
+-----------------------------------------------------------------+
|  H_f > 2.0     | Safe Zone      | Low liquidation risk           |
|  1.5 - 2.0     | Caution Zone   | Monitor during volatility       |
|  1.0 - 1.5     | Danger Zone    | High risk, add collateral       |
|  H_f < 1.0     | LIQUIDATION    | Smart contract liquidates asset |
+-----------------------------------------------------------------+
Applying quantitative crypto data analysis allows experienced Web3 traders to optimize yield strategies while managing exposure risks.
Real-World Examples & Use Cases: Data-Driven DeFi Decisions
Let’s explore real-world scenarios illustrating how actionable cryptocurrency market data translates directly into smarter financial moves.
Scenario A: Avoiding a Liquidity Trap on a Yield Aggregator
- Context: A user spots an enticing $150\%$ APY vault on an emerging layer-2 network.
- Data Check: The trader checks reliable crypto market data tools and discovers that $95\%$ of the yield is paid in a hyper-inflationary reward token with low DEX liquidity. Furthermore, daily sell pressure outpaces buyer inflow by 10 to 1.
- Outcome: Recognizing that the token price will drop fast due to inflation, the user avoids the trap. Instead, they choose a stablecoin-ETH pool offering $18\%$ APY derived entirely from swap fees.
Scenario B: Arbitrage and Liquidation Monitoring
- Context: During sudden market volatility, asset prices diverge across decentralized exchanges.
- Data Check: Quantitative traders monitoring high-frequency crypto data notice that Ethereum is trading at $\$3,100$ on Uniswap but $\$3,125$ on a secondary DEX due to temporary pool imbalance.
- Outcome: Automated trading bots deploy flash loans to buy low on Uniswap and sell high on the secondary exchange within a single transaction block, netting risk-free arbitrage profit while balancing market prices.
Scenario C: Cross-Chain Liquidity Migration
- Context: A major layer-1 network introduces gas fee subsidies and developer incentives.
- Data Check: Analysts reviewing crypto data notice a $300\%$ increase in stablecoin net inflows toward the network over 48 hours.
- Outcome: Informed investors shift capital early into prime DEXes and lending markets on that chain, capturing high early-stage LP rewards before the broader market catches on.
About Empire Crypto Data
At Empire Crypto Data, our mission is simple: bring clarity, speed, and accuracy to the decentralized financial web.
As a dedicated intelligence division within the Empire Crypto ecosystem, Empire Crypto Data builds institutional-grade research, market tracking tools, and data infrastructure for Web3 users worldwide. Working alongside media and research initiatives like Empire Blockworks, we strip away market noise and deliver clean, verified metrics designed to power confident financial strategies.
Whether you are looking for real-time TVL dashboards, in-depth protocol security reviews, or advanced trading data analysis cryptocurrency solutions, Empire Crypto Data is your trusted analytics partner.
Why Traders Choose Empire Crypto Data:
- Uncompromising Accuracy: Verified on-chain extraction ensuring complete cryptocurrency data reliability.
- Multi-Chain Coverage: Comprehensive data aggregation across Ethereum, Solana, Layer-2s, and emerging chains.
- Institutional Insight: Built by seasoned analysts committed to delivering the best crypto data insights in the industry.
As a premier Empire Crypto empowers individual investors and institutional teams to navigate the multi-chain ecosystem with clarity and efficiency.
Common Risks in Decentralized Finance & How Data Mitigates Them
While decentralized finance offers unprecedented financial freedom, it also comes with unique technical and financial risks. Utilizing accurate crypto data is your first line of defense.
+-------------------------------------------------------------------+
|               Risk Factors vs. Data Mitigation Strategy           |
+-------------------+-----------------------------------------------+
| Risk Type         | How Data Analytics Mitigates It               |
+-------------------+-----------------------------------------------+
| Smart Contract    | Track historical audit records, bug bounty    |
| Bugs & Exploits   | values, and contract deployment age.  |
+-------------------+-----------------------------------------------+
| Impermanent       | Calculate pool volatility ranges and historical |
| Loss (IL)         | price ratio correlations.                   |
+-------------------+-----------------------------------------------+
| Oracle            | Monitor oracle feed refresh latency and verify|
| Manipulation      | multi-source aggregate feeds like Pyth.   |
+-------------------+-----------------------------------------------+
| Cascading         | Track protocol collateral health factors and  |
| Liquidations      | debt ceiling utilization limits.         |
+-------------------+-----------------------------------------------+
Smart Contract Exploits
Smart contracts are written by human developers and can contain vulnerabilities. By checking crypto data platforms for protocol audit histories, total value locked longevity, and bug bounty programs, you lower the risk of depositing funds into vulnerable codebases.
Impermanent Loss in Liquidity Pools
When providing liquidity for volatile pairs (e.g., ETH/USDC), relative price changes between the assets cause impermanent loss compared to holding them outright. Analyzing historical pool volume data helps ensure that fee yield generation outpaces potential impermanent loss.
Oracle Failure and Price Manipulation
Low-liquidity assets can be artificially inflated on thin exchanges to manipulate lending protocol prices and drain collateral pools. Accessing first-party oracle metrics powered by high-frequency networks like Pyth helps verify data accuracy before entering leverage positions.
Relying on a robust crypto data solution ensures you are never caught unprepared during volatile market swings.
Comparative Analysis: Top DeFi Analytics Tools
To navigate Web3 effectively, you need the right tools in your stack. Here is a comparison of top crypto data solutions used by industry professionals.
| Platform | Primary Specialty | Key Metrics Tracked | Target User |
| Empire Crypto Data | Comprehensive DeFi Intelligence & Analytics | Multi-chain TVL, Real Yield, Protocol Audits, Risk Metrics. | Beginners to Institutional Traders |
| DefiLlama | Open-source TVL & Protocol Tracking | Multi-chain TVL, Treasury Holdings, Protocol Revenue. | General Crypto Community |
| Dune Analytics | Custom SQL On-Chain Querying | Raw Blockchain Queries, Custom User Dashboards. | Data Analysts & Engineers |
| CoinMarketCap / CoinGecko | Token Market Data & Pair Discovery | Spot Prices, Market Cap, DEX Security Checks, Volume. | General Retail Traders |
| Pyth Network | On-Chain Oracle Feeds | High-Frequency Real-Time Asset Pricing. | Protocol Developers & Quant Traders |
Selecting the best crypto data stack tailored to your workflow is key to maintaining a competitive edge in Web3.
Step-by-Step Checklist for Evaluating a DeFi Protocol
Before depositing your hard-earned assets into any decentralized application, run through this verification checklist powered by crypto data:
1. Verify Smart Contract Audits (Check for audited, immutable code bases).

2. Check TVL Trendline (Ensure 30-day TVL is stable or growing organically).

3. Analyze Yield Source (Confirm rewards come from organic fees, not dilution).
4. Assess Liquidity Depth (Test swap slippage for your target deposit size).

5. Review Wallet Concentration (Ensure top 10 wallets do not hold >50% of supply).

6. Inspect Oracle Reliability (Verify multi-source or high-frequency price feeds).

7. Monitor Social & Developer Activity (Check active GitHub commits and community health).
Frequently Asked Questions (FAQ)
What is crypto data in the context of DeFi?
Crypto data refers to the aggregated, indexed, and analyzed metrics generated by blockchain transactions, smart contract state changes, and decentralized application activities. It includes metrics like Total Value Locked (TVL), trading volume, liquidity pool depth, fee revenues, and collateral health ratios.
How do I choose the best crypto data tools for my trading?
Selecting the best platform depends on your goals. For overall protocol health, TVL, and risk analysis, platforms like Empire Crypto Data provide curated, high-precision dashboards. For low-level on-chain SQL analysis, tools like Dune are ideal, while CoinMarketCap and CoinGecko excel at token pair discovery.
Why is Total Value Locked (TVL) such a critical metric?
TVL represents the cumulative value of assets deposited into a protocol’s smart contracts. It serves as a measure of trust, capital efficiency, and market adoption. Higher TVL generally indicates deeper liquidity, lower trade slippage, and strong community backing.
What is the difference between real yield and emission yield?
Real yield is generated from actual commercial usage of a platform, such as trading fees paid on DEXes or borrowing interest collected by money markets. Emission yield is paid in newly minted protocol tokens, which can dilute token value over time if not backed by organic demand.
How does Empire Crypto Data ensure data accuracy?
Empire Crypto Data extracts information directly from open-source blockchain nodes, smart contract calls, and verified indexers. By cleaning raw data and removing double-counted balances across multi-chain bridges, Empire Crypto Data delivers industry-leading cryptocurrency data reliability.
Conclusion: Take Control of Your DeFi Strategy with Crypto Data
Decentralized finance has opened up global, permissionless economic opportunity. However, succeeding in Web3 requires moving past speculation and relying on clear, verified metrics.
By understanding key metrics like TVL, capital efficiency, health factors, and real yield structures, you can navigate decentralized markets with confidence. Incorporating accurate crypto data into your daily routine helps you protect your capital, optimize yields, and stay ahead of key market shifts.
Ready to elevate your Web3 research? Make Crypto Data your main resource for real-time market tracking, protocol reviews, and institutional-grade analytics. Explore the suite of analytics at Empire Crypto Data today and transform raw blockchain insights into your strategic edge!