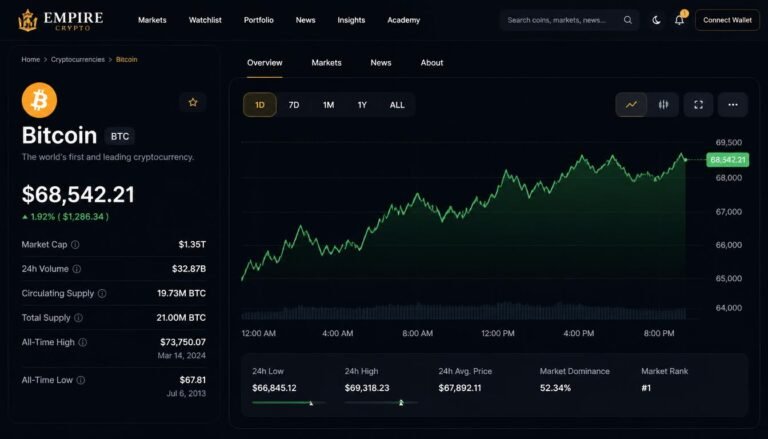
Navigating the volatile landscape of blockchain assets can feel overwhelming, but mastering Crypto Data gives you an unprecedented edge over the market. Whether you are a newcomer buying your first fraction of Bitcoin or an experienced trader refining algorithmic strategies, numbers rule this financial space. In digital finance, price tells you what happened, but data tells you why it happened—and what is likely to happen next.

What is Crypto Data and Why Does It Matter?
At its core, Crypto Data refers to the vast collection of quantitative and qualitative information generated across public blockchain networks and centralized trading venues. Unlike traditional equities, where corporate reporting occurs quarterly behind closed doors, public ledgers broadcast every transaction, wallet interaction, and smart contract execution in real time.
+-----------------------------------------------------------------------+
|                           CRYPTO DATA SYSTEM                          |
+-----------------------------------+-----------------------------------+
                                    |
            +-----------------------+-----------------------+
            |                                               |
  Off-Chain Data Sources                         On-Chain Data Sources
  - Spot & Futures Order Books                   - Wallet Balances
  - Exchange Volumes & Spreads                   - Transaction Throughput
  - Social Sentiment Metrics                     - Smart Contract Calls
The Shift from Speculation to Data-Driven Investing
The digital asset ecosystem has evolved from a retail speculation arena into a multi-trillion-dollar institutional asset class. Today, relying on intuition or hype leads to poor capital allocation. Utilizing structured crypto data empowers market participants to:
- Eliminate Emotional Bias: Make objective decisions grounded in verifiable numbers rather than fear or excitement.
- Identify Market Regimes: Distinguish between accumulation cycles, parabolic expansion, and distribution phases.
- Assess True Value: Evaluate protocols based on revenue, total value locked (TVL), and active users rather than marketing narratives.
- Mitigate Risk: Monitor liquidity depth and liquidation cascades before placing trades.
Key Categories of Cryptocurrency Data
To build an effective analytical framework, you must understand the primary types of cryptocurrency data available across the market.
1. Market Data
Market data reflects trading activity taking place on centralized exchanges (CEXs) and decentralized exchanges (DEXs).
- Price & Candlestick Patterns: High, Low, Open, and Close (OHLC) values over defined timeframes.
- Trading Volume: The aggregate value of assets traded within a 24-hour window.
- Order Book Depth: The density of buy and sell orders at various price levels, indicating immediate liquidity.
2. On-Chain Data
On-chain metrics measure direct activity on the underlying blockchain network.
- Active Addresses: Unique wallet addresses participating in transactions daily.
- Network Hashrate: Total computational power securing Proof-of-Work networks like Bitcoin.
- Token Distribution: The concentration of token supply among top wallets (“whales”).
3. Derivatives & Sentiment Data
Derivatives offer insights into leveraged market positioning.
- Open Interest (OI): Total active derivative contracts that have not been settled.
- Funding Rates: Periodic payments between long and short traders in perpetual futures markets.
- Sentiment Aggregators: Fear & Greed indices, social volume, and developer commits on GitHub.
Essential Metrics in Crypto Market Data
When evaluating crypto market data, several fundamental metrics serve as the baseline for every analysis.
+------------------------------------------------------------------------+
|                      CORE MARKET METRICS BREAKDOWN                     |
+---------------------+--------------------------------------------------+
| Metric              | Primary Value to Analysts                        |
+---------------------+--------------------------------------------------+
| Market Cap          | Determines relative size and market valuation    |
| 24h Volume          | Validates price momentum and liquidity           |
| Fully Diluted (FDV) | Uncovers future supply inflation risks           |
| TVL                 | Measures protocol adoption in DeFi               |
+---------------------+--------------------------------------------------+
Market Capitalization vs. Fully Diluted Valuation (FDV)
- Market Capitalization: Calculated as $\text{Current Price} \times \text{Circulating Supply}$. It represents the current floating value of the asset.
- Fully Diluted Valuation (FDV): Calculated as $\text{Current Price} \times \text{Max Supply}$. This metric reveals the market cap if all tokens were released today.
Risk Indicator: A massive divergence between circulating supply and total supply (low float, high FDV) often signals upcoming unlock pressure that can dilute token value over time.
Liquidity and Bid-Ask Spread
Relying on price alone can be misleading without evaluating crypto data regarding market depth. Thin order books mean large buy or sell orders will experience significant slippage, executing at unfavorable prices.
Looking at best crypto data platforms reveals that order book depth within 2% of the mid-price provides a far clearer picture of stability than 24-hour trading volume alone.
On-Chain vs. Off-Chain Data Analytics Cryptocurrency
Navigating data analytics cryptocurrency requires mastering two parallel streams: on-chain intelligence and off-chain market feeds.
+------------------------------------------------------------------------+
|                     ON-CHAIN VS. OFF-CHAIN DATA                        |
+-----------------------------------+------------------------------------+
| On-Chain Analytics                | Off-Chain Market Data              |
+-----------------------------------+------------------------------------+
| Settlement Layer Verification     | Off-Chain Exchange Matching Engines|
| Real-time Whale Movements         | High-Frequency Order Book Quotes   |
| Gas Usage & Contract Interaction  | Social Media & News Sentiment      |
| Permanent Historical Record       | Aggregated API Feeds               |
+-----------------------------------+------------------------------------+
Deep Dive: On-Chain Analytics
Analyzing crypto data directly on-chain exposes institutional capital movements before they reflect on public charts. Key indicators include:
- Exchange Net Flows: High inflows of assets into exchange wallets indicate potential selling pressure. Conversely, significant exchange outflows signal cold storage accumulation.
- Realized Price: Measures the average cost basis of coins based on when they last moved on-chain. This highlights structural support and resistance levels.
- MVRV Ratio (Market Value to Realized Value): Compares market capitalization to realized capitalization to pinpoint macro market tops and bottoms.
Deep Dive: Off-Chain Market Analytics
Off-chain feeds deliver high-frequency updates necessary for spot and futures traders. Incorporating reliable data crypto solutions helps track leverage buildup, funding rate shifts, and liquidation levels across global exchanges.
Step-by-Step Beginner Guide to Using Crypto Data
If you are new to the asset class, applying structured crypto data analysis will transform how you approach digital markets. Follow this multi-step framework:
+------------------------------------------------------------------------+
|                    BEGINNER ANALYTICAL WORKFLOW                        |
+------------------------------------------------------------------------+
  Step 1: Check Market Structure (Market Cap, FDV, 24h Volume)
                             │
                             ▼
  Step 2: Verify On-Chain Fundamentals (Active Users, Revenue)
                             │
                             ▼
  Step 3: Analyze Derivatives Positioning (Funding Rates, Open Interest)
                             │
                             ▼
  Step 4: Execute & Monitor via Trusted Crypto Data Solutions
+------------------------------------------------------------------------+
Step 1: Verify Core Metrics
Before buying an asset, analyze its circulating supply, inflation schedule, and daily trading volume. Avoid tokens with low liquidity across secondary markets.
Step 2: Examine On-Chain Adoption
Use public block explorers and analytics suites to confirm active daily user growth. Strong price performance backed by declining user adoption suggests speculative bubbles.
Step 3: Monitor Exchange Reserves
Check whether holders are moving assets to centralized venues to sell or withdrawing them into self-custody. Sustained exchange withdrawals indicate accumulation.
Step 4: Leverage Structured Tools
Integrating a robust crypto data solution allows you to automate tracking, setup alerts, and avoid manual errors in chart interpretation.
Advanced Section: Trading Data Analysis Cryptocurrency
For quant traders and experienced market participants, high-level trading data analysis cryptocurrency requires evaluating complex market microstructures.
Cumulative Volume Delta (CVD)
CVD measures the net difference between buying and selling pressure in order flows over time.
- Bullish Divergence: Price reaches a lower low while CVD reaches a higher low, indicating aggressive limit buy orders absorbing market sells.
- Bearish Divergence: Price pushes higher while CVD trends downward, signaling buyer exhaustion.

Liquidations and Open Interest Cascades
When leveraged positions accumulate, market markers often trigger rapid price movements toward clusters of stop-loss orders. Institutional quants rely on Empire Crypto heatmaps to map out high-density liquidation zones, entering trades after forced liquidations clean out over-leveraged market participants.
+------------------------------------------------------------------------+
|                  LIQUIDATION CASCADE DYNAMICS                          |
+------------------------------------------------------------------------+
  Price Moves Toward Liquidation Density Zone
                     │
                     ▼
  Stop-Losses / Forced Liquidations Triggered ($100M+)
                     │
                     ▼
  Rapid Volatility Spike & Market Rebalancing
                     │
                     ▼
  Smart Money Enters Counter-Trend Position
+------------------------------------------------------------------------+
Cryptocurrency Data Reliability & Solutions
As institutional adoption expands, cryptocurrency data reliability has become a critical operational requirement. Inaccurate pricing API feeds or delayed block indices can lead to failed arbitrage trades or unexecuted liquidations.
Challenges in Data Integrity
- Wash Trading: Artificial trade activity engineered to inflate exchange volume metrics.
- API Latency: Lag between blockchain state updates and third-party dashboard displays.
- Fragmented Liquidity: Dispersed trading pairs across dozens of layer-1 networks and layer-2 scaling environments.
Choosing an enterprise-grade crypto data company ensures that API feeds undergo rigorous cross-exchange normalization, cleansing outliers and delivering dependable feeds for algorithmic trading and portfolio reporting. Modern enterprise environments count on structured crypto data solutions to maintain operational uptime.
Real-World Use Cases: Turning Data into Action
To highlight the value of quantitative research, let us review three practical market scenarios where structured insights directly influenced trading outcomes:
+------------------------------------------------------------------------+
|                     REAL-WORLD CASE STUDIES                            |
+------------------+-----------------------+-----------------------------+
| Scenario         | Key Data Signal       | Actionable Outcome          |
+------------------+-----------------------+-----------------------------+
| 1. Market Top    | Extreme Funding Rates | Exit long / Hedge exposure  |
| 2. Accumulation  | High Exchange Outflows| Spot accumulation           |
| 3. Protocol Risk | TVL Drain Divergence  | Withdraw smart contract LP  |
+------------------+-----------------------+-----------------------------+
Case 1: Identifying a Local Top via Funding Rates
During a rapid Bitcoin rally, spot prices increased by 15% in 48 hours. However, perpetual futures funding rates spiked past +0.1% per eight-hour interval, signaling extreme long leverage overextension. Traders utilizing accurate cryptocurrency market data closed long positions before a leverage flush caused a 10% pullback.
Case 2: Spotting Institutional Accumulation
While altcoin prices consolidated sideways for three months, on-chain metrics showed continuous exchange outflows combined with rising long-term holder supply. Investors tracking this crypto data accumulated positions prior to a broad protocol breakout.
Case 3: De-Risking Ahead of Liquidity Drain
A decentralized lending protocol saw its price hold stable while its total value locked (TVL) dropped 40% over 72 hours. Analysts utilizing cryptocurrency data analytics recognized smart capital withdrawing assets and exited positions before token prices adjusted to lower protocol utility.
About Empire Crypto Data & Empire Crypto
When navigating fast-moving Web3 financial markets, having a reliable intelligence partner makes all the difference.
+------------------------------------------------------------------------+
|                      EMPIRE CRYPTO DATA ECOSYSTEM                      |
+------------------------------------------------------------------------+
  - High-Speed Enterprise APIs & Normalized Exchange Feeds
  - Real-Time On-Chain Tracking & Smart Money Alerts
  - Professional Grade Analytical Dashboards & Quant Tools
  - Published Research from Empire Blockworks & Empire Crypto
+------------------------------------------------------------------------+
Empowering Market Participants worldwide
At Empire Crypto Data, we pioneer institution-grade analytics, delivering real-time execution metrics, normalized exchange data, and deep on-chain intelligence. Developed under the broader Empire Crypto ecosystem, our mission is to make complex blockchain metrics intuitive, scannable, and actionable for traders at every experience level.
Whether you seek unified REST and WebSocket endpoints for your trading platform or specialized macro insights, Empire Crypto Data sets the industry standard for accuracy and reliability. Through strategic content partnerships with networks like Empire Blockworks, we deliver the tools, research, and infrastructure needed to thrive in modern crypto markets.
Frequently Asked Questions (FAQ)
What is the primary difference between on-chain and off-chain crypto data?
On-chain metrics are retrieved directly from public blockchain ledgers (such as wallet balances, smart contract execution, and transaction fees), while off-chain data originates from trading venues (such as order book depth, bid-ask spreads, and trade execution volume).
How do funding rates help predict market volatility?
Funding rates reflect the cost of holding long or short perpetual futures positions. Extremely positive funding rates indicate over-leveraged buyers, making the market vulnerable to rapid downside cascades, while negative funding rates signal heavy short positioning.
Why is fully diluted valuation (FDV) important for long-term investors?
FDV indicates what an asset’s total market value would be if all tokens were minted and in circulation. A high FDV relative to current market cap signals future supply inflation that can create downward price pressure during token unlocks.
Where does Empire Crypto fit into digital asset research?
Empire Crypto provides professional market infrastructure, research frameworks, and institutional tools designed to simplify complex market analytics for retail and professional users alike.
Conclusion: Build Your Strategic Advantage Today
In the era of modern digital finance, access to structured Crypto Data is no longer optional—it is your fundamental edge. By moving beyond simple price charts and integrating market volume, on-chain metrics, and derivatives positioning into your daily routine, you can navigate volatile market cycles with confidence.
Transform your analytical framework today. Partner with Empire Crypto Data to access institutional tools, reliable data streams, and market research designed to help you master digital assets.